
Indicator
This indicator looks at waste generated in the port area, excluding ship generated waste. This indicator is relative, expressed as a share, comparing the amount of generated waste in the port area that can be recycled, reused or repurposed, to the total amount of collected waste. It gives an insight into the value of the waste generated in the port area.
The port area is defined as the geographical territory managed by the Port Management Body.
How to measure its value
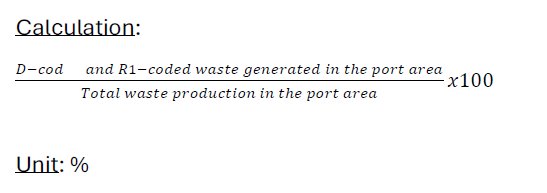
Waste is defined according to the definition set in EU legislation as “any substance, material or object which the holder discards or intends or is required to discard” (EU Waste Framework Directive 2008). Non-recycled waste is defined by all waste which is classified as D-coded or R1-coded waste according to the EU’s Waste Framework Directive coding system. In other words, all waste which is deposited, landfilled, released into water bodies, incinerated, or used for energy generation, is defined as non-recycled waste.
Waste handling reports can be retrieved from waste management operators and/or government (public waste management agency) data. In Flanders, the Public Waste Agency OVAM holds a MATIS-database on tonnage of waste generated, linked to the processing means (R for recovery or D for disposal). It needs to be linked to the VAT-numbers of the companies located in the Port area. These can be obtained through the PMB and/or the National Crossroads Bank for Enterprises.
Limitations
- There are a lot of steps involved in gathering and processing the appropriate data, which might lead to high impact of missing information. (missing local branch VAT-numbers, incorrect waste reporting, etc..). It would be advisable to timely start building a list of all companies/ branch units present in the port area and match them with correct VAT- numbers.
- A percentage of the waste generated might not have an R or D-code assigned.